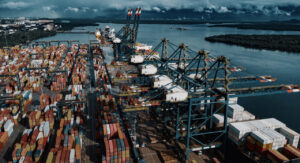
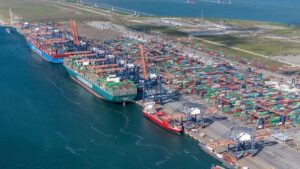
An infographic published by Datavizblog and belonging to Globe Reprints shows the geographical location of the Panama Canal, as well as the difference between the old and the new locks.
The infographic shows that more than 99 million tonnes of cargo travelled from the US East Coast to Asia in 2013, which the Panama Canal will likely increase in the coming years.
The expansion project is due to be completed in April 2016, should any complications relating to the lock crack be fully resolved.
If the image appears too small in your browser, click on the infographic to be taken to the original post. (Source: Globe Reprints)


