Full-year 2015 demand statistics are now in and show that the trade imbalance widened for ‘East-West’ trades, but narrowed for ‘North-South’ lanes, According to the latest Container Insight report released by Drewry, with the maritime advisors asking which trades were hot or cold last year.
The overall growth rate hides some of the far larger ups and downs witnessed across the trades.
For example, the main East-West trades between them could only manage head haul growth of 1.7% (equal to an extra 625,000 TEU) but growth rates ranged from a high of 16.4% for Asia-to-East Coast North America to a low of -4.0% for Asia-to-Mediterranean.
There were similar variations for the East-West backhaul trades and both legs of the North-South trades.
Percentage changes on their own can be misleading taken out of context; for example the 9.5% drop in two-way Asia-West Africa volumes represented a net deficit of 173,000 TEU, which is roughly the same TEU loss as for Asia-Med and Asia-West Coast North America, which declined by 2.4% and 0.9%, respectively.
The biggest drag on volumes has been the backhaul on the East-West routes. Return traffic in 2015 was lower than it was in 2012 by some 200,000 TEU.

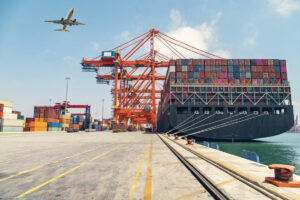
(Source: iStock)
Over the same period, East-West front haul volumes have added 4.5 million TEU, while the aggregate North-South volumes have added 2.2 million TEU and 1.0 million TEU for the head haul and backhaul, respectively.
Drewry sees this as having two important implications; firstly, it suggests that Asian importers are looking to broaden their sourcing origins to regions such as the Middle East and South Asia away from North America and to a lesser extent Europe, reducing the long-term outlook for those export markets.
Secondly, East-West carriers will have to endure higher equipment repositioning costs as the trade imbalance widens.
In 2015, carriers operating between Asia and North America had to reposition 1.2 million TEU more than they did in 2014 due to widening imbalances.
Between Asia and Europe (including the Mediterranean) the amount of repositioning decreased by around 600,000 TEU, but the total remained very high at around 7.8 million.
In 2015, there were 2.2 TEU moved for every one backhaul TEU in the Asia-Europe, Transpacific and Transatlantic lanes.
The aggregate ratio was below two times until 2014. For individual trades, the widest gap exists on the Asia-WCNA route at x2.7, up from x2.1 in 2012.
In contrast, faster backhaul growth in the North-South sector reduced the overall trade imbalance there to x2.07 in 2015, from x2.14 in 2014.
The Drewry View: The East-West trades were a bad place to be for ocean carriers in 2015. Carrier profitability/losses in 2016 will be heavily influenced by the exposure to hot or cold trades, while carriers should also expect additional associated empty container repositioning costs from the widening East-West services trade gap.